Project Outline
The objective is to find out the comparative scale for evaluation of the quality of university education and results for India and USA
Research Information
USA:
TOP 15 COLLEGES IN USA:
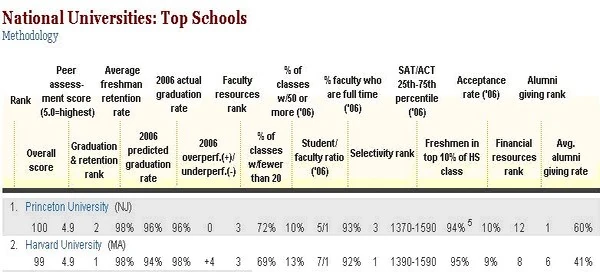
According to America's Best Colleges, US News, 2008:
Universities next in the rank:
| Rank | Name Of the University |
|---|---|
| Yale University(CT) | |
| Stanford University(CA) | |
| University of Pennsylvania | |
| California Institute of Technology | |
| Massachusetts Institute of Technology | |
| Duke University(NC) | |
| Columbia University(NY) | |
| University of Chicago | |
| Dartmouth College(NH) | |
| Washington University in St. Louis | |
| Cornell University(NY) | |
| Brown University(RI) | |
| Northwestern University(IL) |
http://www.usnews.com/usnews/edu/college/rankings/brief/t1natudoc_brief.php
UNDERGRADUATE RANKING CRITERIA AND WEIGHTS:
The U.S. News college rankings, published on usnews.com Aug. 18, 2007, are based on several key measures of quality, described below. U.S. News uses these measures to capture the various dimensions of academic quality at each college. These measures fall into seven broad categories: peer assessment; graduation and retention rate; faculty resources (for example, class size); student selectivity (for example, average admission test scores of incoming students); financial resources; alumni giving; and, only for national universities and liberal arts colleges, graduation rate performance. The indicators include both input measures, which reflect the quality of students, faculty, and other resources used in education, and outcome measures, which capture the results of the education an individual receives.
Scores for each measure are weighted as shown to arrive at a final overall score. A more detailed explanation of the ranking indicators and methods appears below in our methodology and our definitions of ranking criteria.
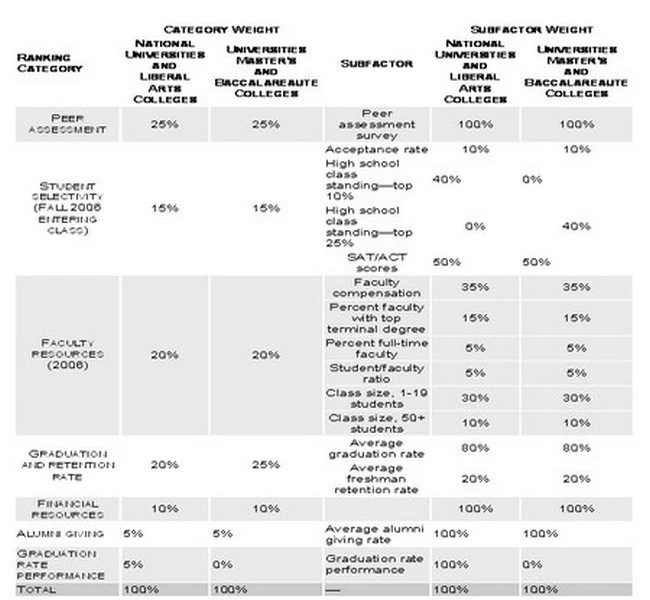

This graph shows the relative weights assigned to each category of indicator for national universities and liberal arts colleges.

This chart shows the weights assigned to factors used to rank the universities-master's and baccalaureate colleges. Because graduation rate performance is not used to rank these groups, the graduation and retention rate variables receive a higher weight.
DEFINITIONS OF RANKING CRITERIA:
- ACCEPTANCE RATE: The ratio of the number of students admitted to the number of applicants for fall 2006 admission. The acceptance rate is equal to the total number of students admitted divided by the total number of applicants. Both the applications and acceptances counted only first-time, first-year students.
- ALUMNI GIVING: The average percentage of undergraduate alumni of record who donated money to the college or university. Alumni of record are former full- or part-time students who received an undergraduate degree and for whom the college or university has a current address. Graduates who earned only a graduate degree are excluded. Undergraduate alumni donors are alumni with undergraduate degrees from an institution who made one or more gifts for either current operations or capital expenses during the specified academic year. The alumni giving rate is calculated by dividing the number of appropriate donors during a given academic year by the number of appropriate alumni of record for that year. These two separate rates were averaged for the 2005 and 2006 academic years. The percentage of alumni giving serves as a proxy for how satisfied students are with the school.
- AVERAGE FRESHMAN RETENTION RATE: The percentage of first-year freshmen who returned to the same college or university the following fall, averaged over the first-year classes entering between 2002 and 2005.
- AVERAGE GRADUATION RATE: The percentage of freshmen who graduated within a six-year period, averaged over the classes entering between 1997 and 2000. (Note: This excludes students who transferred into the school.)
- CLASS SIZE, 1-19 STUDENTS: The percentage of undergraduate classes, excluding class subsections, with fewer than 20 students enrolled during the fall of 2006.
- CLASS SIZE, 50+ STUDENTS: The percentage of undergraduate classes, excluding class subsections, with 50 students or more enrolled during the fall of 2006.
- EXPENDITURES PER STUDENT: Financial resources are measured by the average spending per full-time-equivalent student on instruction, research, public service, academic support, student services, institutional support, and operations and maintenance (for public institutions only) during the 2005 and 2006 fiscal years. The number of full-time-equivalent students is equal to the number of full-time students plus one third of the number of part-time students. (Note: This includes both undergraduate and graduate students.) We first scaled the public service and research values by the percentage of full-time-equivalent undergraduate students attending the school. Next, we added in total instruction, academic support, student services, institutional support, and operations and maintenance (for public institutions only) and then divided by the number of full-time-equivalent students. After calculating this value, we applied a logarithmic transformation to the spending per full-time-equivalent student, prior to standardizing the value. This calculation process was done for all schools.
- FACULTY COMPENSATION: The average faculty pay and benefits are adjusted for regional differences in cost of living. This includes full-time assistant, associate, and full professors. The values are taken for the 2005-2006 and 2006-2007 academic years and then averaged. (The regional differences in cost of living are taken from indexes from Runzheimer International.)
- FACULTY WITH PH.D.'S OR TOP TERMINAL DEGREE: The percentage of full-time faculty members with a doctorate or the highest degree possible in their field or specialty during the 2006-2007 academic year.
- GRADUATION RATE PERFORMANCE: The difference between the actual six-year graduation rate for students entering in the fall of 2000 and the predicted graduation rate. The predicted graduation rate is based upon characteristics of the entering class, as well as characteristics of the institution. If a school's actual graduation rate is higher than the predicted rate, then the school is enhancing achievement. This measure is included in the rankings for schools in the National Universities and Liberal Arts Colleges categories only.
- HIGH SCHOOL CLASS STANDING: The proportion of students enrolled for the academic year beginning in the fall of 2006 who graduated in the top 10 percent (for national universities and liberal arts colleges) or 25 percent (master's and baccalaureate colleges) of their high school class.
- PEER ASSESSMENT: How the school is regarded by administrators at peer institutions. A school's peer assessment score is determined by surveying the presidents, provosts, and deans of admissions (or equivalent positions) at institutions in the school's category. Each individual was asked to rate peer schools' undergraduate academic programs on a scale from 1 (marginal) to 5 (distinguished). Those individuals who did not know enough about a school to evaluate it fairly were asked to mark "don't know." A school's score is the average score of all the respondents who rated it. Responses of "don't know" counted neither for nor against a school. The survey was conducted in the spring of 2007, and about 51 percent of those surveyed responded.
- PROPORTION OF FULL-TIME FACULTY: The proportion of the 2006-2007 full-time-equivalent faculty that is full time. The number of full-time-equivalent faculty is equal to the number of full-time faculty plus one third of the number of part-time faculty. (Note: We do not include the following: faculty in preclinical and clinical medicine; administrative officers with titles such as dean of students, librarian, registrar, or coach, even though they may devote part of their time to classroom instruction and may have faculty status; undergraduate or graduate students who are teaching assistants or teaching fellows; faculty on leave without pay; or replacement faculty for those faculty members on sabbatical leave.) To calculate this percentage, the total full-time faculty is divided by the full-time-equivalent faculty.
- SAT/ACT SCORES: Average test scores on the Critical Reading and Math portions of the SAT or Composite ACT of all enrolled first-time, first-year students entering in 2006. Before being used as a ranking indicator, the scores are converted to the percentile of the national distribution corresponding to that school's scores.
- STUDENT/FACULTY RATIO: The ratio of full-time-equivalent students to full-time-equivalent faculty during the fall of 2006, as reported by the school. Note: This excludes faculty and students of law, medical, business, and other stand-alone graduate or professional programs in which faculty teach virtually only graduate-level students. Faculty numbers also exclude graduate or undergraduate students who are teaching assistants.
http://www.usnews.com/usnews/edu/college/rankings/about/weight_brief.php
INDIA:
GOVERNMENT RATINGS:
NATIONAL ASSESSMENT AND ACCREDITATION COUNCIL:
Established in 1994 by the University Grants Council, the National Assessment and Accreditation Council (NAAC) is responsible for evaluating and accrediting Indian institutions of higher education and academic departments. Accredited institutions are awarded an overall grade (with a pass/fail threshold) on a scale of A++ to C. The NAAC grading scale has been revised on a number of occasions, changing from a pilot A to E grading pattern, to a five-star scale, to its current nine-point alphabetical scale.
As in the United States, the accreditation process is voluntary; unlike the United States, not all institutions interested in establishing their academic credibility have submitted their institutions and programs for review. However, at the time of writing a total of 128 universities and 2883 colleges had received a “grade” under the NAAC system of assessing institutions.
NAAC accreditation is based on a three-stage process:
- Preparation of a self-study report by the institution.
- Institutional visit by an external evaluation team.
- Grading, certification and accreditation based on the results of the previous two stages.
Both the star system and the current system are based on a 100-point scale. Institutions are graded according to the score they receive:
| SCORE | NAAC CURRENT GRADING SYSTEM | ORIGINAL STAR SCALE |
|---|---|---|
A score below 55 percent is considered a failing grade and accreditation is not awarded. Accreditation is good for five years.
COMMERCIAL RANKINGS:
DATAQUEST SURVEY:
In June 2006 the IT trade magazine Dataquest published its third annual ranking of technology schools with a strong information technology focus. Not surprisingly, the Indian Institutes of Technology (IITs) featured prominently, followed closely by the Indian Institutes of Information Technology (IIIT), and the National Institutes of Technology (NITs, formerly RECs), among a sprinkling of others. It should be noted that the criteria, indicators and weightings for the 2006 ranking are not the same for 2005, and a year-on-year comparison should be conducted with that in mind.
METHODOLOGY:
The Dataquest rankings are based on a survey of recruiters and questionnaires sent to schools and institutes. Seventy-five percent of the overall score is based on response from the schools and 25 percent on response from IT recruiters. A total of 250 schools were contacted for the assessment, and 60 leading IT companies were invited to be part of the recruiter survey. The final size of the survey was 100 schools – those that did not respond in time or provided incomplete data were excluded.
The main criteria and weightings for school-provided data (worth 75 percent of the total) were: placements (40%, 7 indicators), infrastructure (10%, 8 indicators), academic environment/intellectual capital (20%, 7 indicators), industry interface (5%, 3 indicators). The perception score (worth 25 percent of the total) is based on interviews with recruiters who were asked to name their top schools for recruitment purposes.
RESULTS: DQ- TOP 20 TECHNOLOGY SCHOOLS:
| RANK | PREVIOUS RANK | INSTITUTE | SCORE |
|---|---|---|---|
| IIT-Madras | |||
| IIT-Delhi | |||
| IIT-Kharagpur | |||
| IIT-Guwahati | |||
| IIT-Bombay | |||
| IIT-kanpur | |||
| IIT-Roorkee | |||
| BITS-Pilani | |||
| Beijing Normal University | |||
| IIIT-Hyderabad | |||
| IIIT-Allahabad | |||
| NIT-Warangal | |||
| NIT-Tiruchirapalli | |||
| NIT-Calicut | |||
| Delhi College of Engineering | |||
| Netaji Subhash Institute of Technology, Delhi | |||
| BIT-Mesra, Ranchi | |||
| Jadavpur University, Kolkata | |||
| MNNIT-Allahabad | |||
| Thapar Institute of Engg & Technology, Patiala |
Source: Dataquest-IDC T-School Survey (June 2006)
- The top 100 is available from:
<www.dqindia.com/images06/Complete%20Score%20Card.pdf>
INDIA TODAY SURVEY:
Possibly the longest running ranking in India, the annual Top 10 Colleges report by the news weekly India Today rates the nation’s colleges in the arts, science, commerce, law engineering and medicine. Not unlike its U.S. equivalent, U.S. News & World Report, the India Today college ranking has been open to heavy criticism over the years, but has nonetheless found itself occupying a position of relative (and many would say unwarranted) influence over the decision-making process of prospective university and college students.
METHODOLOGY:
The India Today rankings are based on the findings of an opinion poll of high-ranking university administrators at large state universities, academic experts, and objective data furnished by colleges and collected from their websites, in addition to data taken from secondary data sources such as the India Universities Handbook.
The opinion poll, results from which are used to develop the “perception score,” focus on seven criteria: reputation, curriculum, quality of academic input, student care, admission procedure, infrastructure and job prospects. Those polled only ranked institutions in their particular field of expertise. Factual data is collected only from institutions that receive top scores on the perception ratings. An exact listing of criteria and indicators is not provided, however, the following criteria are offered as examples: number of applicants, admission procedure, pass percentage of students, faculty, infrastructure and campus placement. A 70:30 overall weighting is applied to the perception and data scores respectively.
RESULTS
NO.1 COLLEGES BY FIELD (2006)
| SCHOOL | FIELD |
|---|---|
| St. Xavier’s College, Mumbai | Arts |
| Loyola College, Chennai | Science |
| Shri Ram College of Commerce, Delhi | Commerce |
| All India Institute of Medical Sciences, Delhi | Medicine |
| Indian Institute of Technology, Delhi | Engineering |
| National Law School of India University, Bangalore | Law |
Source: India Today- June 5, 2006
TOP TEN COLLEGES BY FIELD 2005, 2004:
| RANK (2004) | RANK (2005) | NAME OF COLLEGE |
|---|---|---|
| Lady Shri Ram College, Delhi | ||
| Presidency College, Chennai | ||
| Loyola College, Chennai | ||
| St Xavier’s College, Mumbai | ||
| Fergusson College, Pune | ||
| St. Stephen’s College, Delhi | ||
| St. Xavier’s College, Kolkata | ||
| Hindu College, Delhi | ||
| Hindu College, Delhi | ||
| Miranda House, Delhi | ||
| Presidency College, Kolkata |
| RANK (2004) | RANK (2005) | NAME OF COLLEGE |
|---|---|---|
| Loyola College, Chennai | ||
| St. Stephen’s College, Delhi | ||
| Presidency College, Kolkata | ||
| St Xavier’s College, Mumbai | ||
| Presidency College, Chennai | ||
| Fergusson College, Pune | ||
| Elphinstone College, Mumbai | ||
| Hindu College, Delhi | ||
| Hindu College, Delhi | ||
| St Xavier’s College, Kolkata | ||
| Christ College, Bangalore |
| RANK (2004) | RANK (2005) | NAME OF COLLEGE |
|---|---|---|
| Shri Ram College of Commerce, Delhi | ||
| St. Xavier’s College, Mumbai | ||
| BM College of Commerce, Pune | ||
| St. Xavier’s College, Kolkata | ||
| Lady Shri Ram College, Delhi | ||
| Hindu College, Delhi | ||
| Hans Raj College, Delhi | ||
| Loyola College, Chennai | ||
| Bhavan’s College, Mumbai | ||
| Dr. Ambedkar College, Pune |
| RANK (2004) | RANK (2005) | NAME OF COLLEGE |
|---|---|---|
| All India Institute of Medical Sciences, Delhi | ||
| Armed Forces Medical College, Pune | ||
| St. John’s Medical College, Bangalore | ||
| Bangalore Medical College, Bangalore | ||
| JIPMER, Pondicherry | ||
| Christian Medical College, Vellore | ||
| Grant Medical College, Mumbai | ||
| Maulana Azad Medical College, Delhi | ||
| Kasturba Medical College, Manipal | ||
| BJ Medical College, Pune |
| RANK (2004) | RANK (2005) | NAME OF COLLEGE |
|---|---|---|
| Indian Institute of Technology, Delhi | ||
| Indian Institute of Technology, Mumbai | ||
| Indian Institute of Technology, Chennai | ||
| Indian Institute of Technology, Kanpur | ||
| Indian Institute of Technology, Guwahati | ||
| Indian Institute of Technology, Kharagpur | ||
| Indian Institute of Technology, Roorkee | ||
| Indian Institute of Technology, CE, Guindy, Anna University, Chennai | ||
| BIT, Mesra, Ranchi | ||
| Bengal Engineering College, Kolkata |
| RANK (2004) | RANK (2005) | NAME OF COLLEGE |
|---|---|---|
| ILS Law College, Pune | ||
| National Law School of India University, Bangalore | ||
| Symbiosis Society’s Law College, Pune | ||
| National Law Institute University, Bhopal | ||
| Faculty of Law, Delhi University, Delhi | ||
| NALSAR, Hyderabad | ||
| Institute of Legal Studies, Bangalore | ||
| Faculty of Law, BHU, Varanasi | ||
| University College of Law, Bangalore | ||
| Government College of Law, Mumbai |
Source: India Today-June 13, 2006
BUSINESS TODAY SURVEY:
Business Today, a news weekly owned by the India Today Group, published its fourth annual ranking of management schools in 2006. Based exclusively on the results of opinion polls and surveys sent out to students, recruiters and human resource managers, the 2006 rankings produced something of a surprise result in that a non-IIM branded school — Symbiosis Institute of Business Management (SIBM), Pune — took fourth spot ahead of some of the highly prestigious Indian Institutes of Management.
METHODOLOGY:
A shortlist of 30 schools was selected from the results of surveys sent out to MBA aspirants and recruiters who were asked to list all the schools they would consider applying to or recruiting from. Those surveyed were asked to rate schools according to eight criteria: reputation, placement, quality of placement, infrastructure, faculty, teaching methodology, specialist units and admission eligibility. For the 2006 ranking there was a survey sample of 526 respondents, 25 percent of who were “MBA aspirants”.
Those 30 schools that made the “cut” were then assessed by MBA students, young executives (with two to three years' experience) and heads of institutions, all of whom were asked to rate schools according to a range of criteria which included: favorite school, recommended school and the price premium commanded by a brand. The model employed by the Nielson rating agency is designed to calculate the “brand equity index” (BEI) for each school (the same model it uses in rating Fast Moving Consumer Goods!).
RESULTS (2006):
BUSINESS TODAY RANKING OF TOP MANAGEMENT SCHOOLS:
| RANK | INSTITUTION |
|---|---|
| Indian Institute of Management (IIM) Ahmedabad | |
| IIM Bangalore | |
| IIM Calcutta | |
| Symbiosis-Pune | |
| IIM Lucknow | |
| Xavier Labor Relations Institute | |
| Jamnalal Bajaj Institute of Management Studies | |
| IIM Indore | |
| FMS Delhi | |
| IIFT Delhi | |
| IIPM New Delhi | |
| IIM Kozhikode | |
| ICFAI Hyderabad | |
| S.P. Jain Institute of Management & Research | |
| Welingkar Institute of Management | |
| IIPM Mumbai | |
| Narsee Monjee Institute of Management Studies | |
| Tata Institute of Social Sciences | |
| MDI Gurgaon | |
| LIBA Chennai | |
| Bimtech Delhi | |
| XIM Bhubaneshwar | |
| BIM Trichy | |
| Nirma Institute of Management | |
| IMT Ghaziabad | |
| K J Somaiya | |
| Christ College Bangalore | |
| Amity Business School Noida | |
| Osmania Hyderabad | |
| Alliance Business Academy Bangalore |